Rückblick
On October 1st, we successfully launched our new quarterly webinar series Feature Update Live. This webinar series provides you every 3 months with a compact and practical overview of the latest features and improvements in our heatbeat Digital Twin. In the first edition, we were able to present, among other things, our new interactive editing mode for heating network routes, the new Design Cockpit for sizing pipelines, and extensive improvements in the visualization and analysis of measurement data from the heating network.
Highlights from our Digital Twin development
Since we continuously develop our heatbeat Digital Twin with one software update per week, we want to regularly inform you about the most important improvements and new features. In addition to our monthly Feature Update here on the heatbeat Blog, our webinar showed that we were able to summarize some highlights from the past 3 months. These included in this edition, among others:
Editing mode for network routes and connections
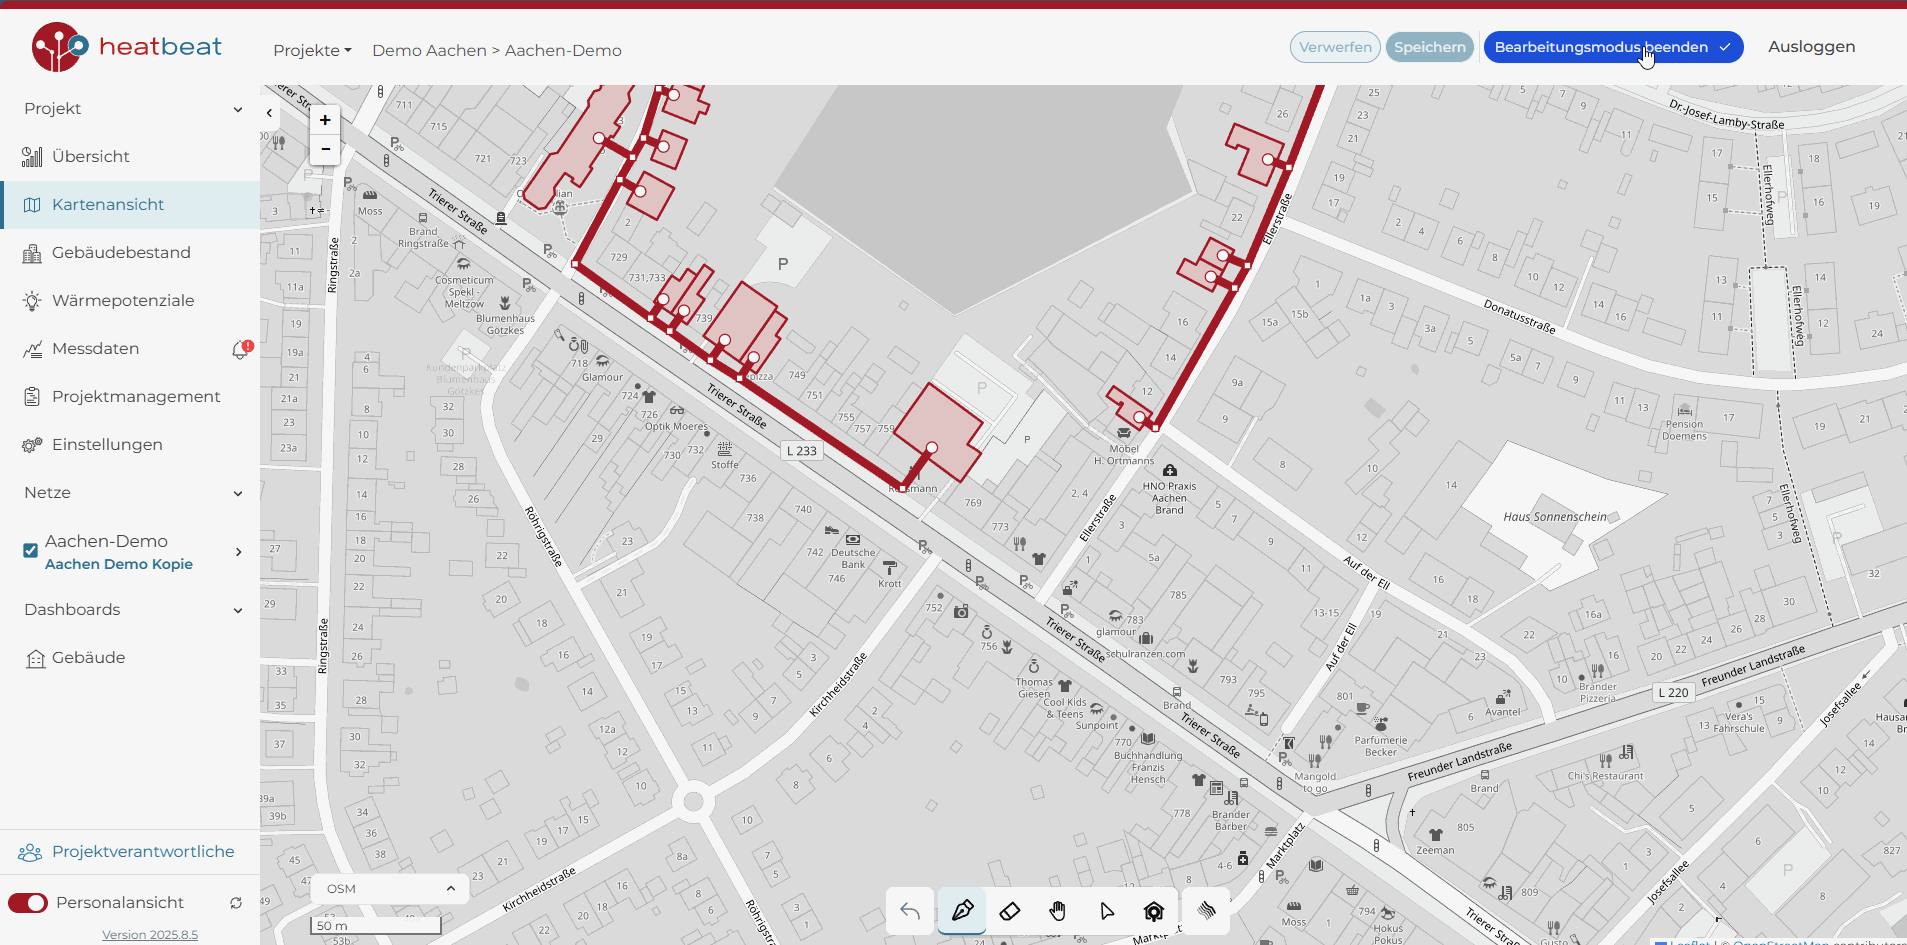
Our new editing mode has been the most requested feature by our customers in recent months, and we are pleased to now offer you the ability to interactively adjust the Digital Twin of your heating network. This allows you to add or remove network connections, adjust pipeline routes, and modify nominal diameters directly in the map view. This way, your digital twin can evolve with the development of the real network, and you can independently manage variants and evaluate future scenarios.
Design Cockpit for network sizing
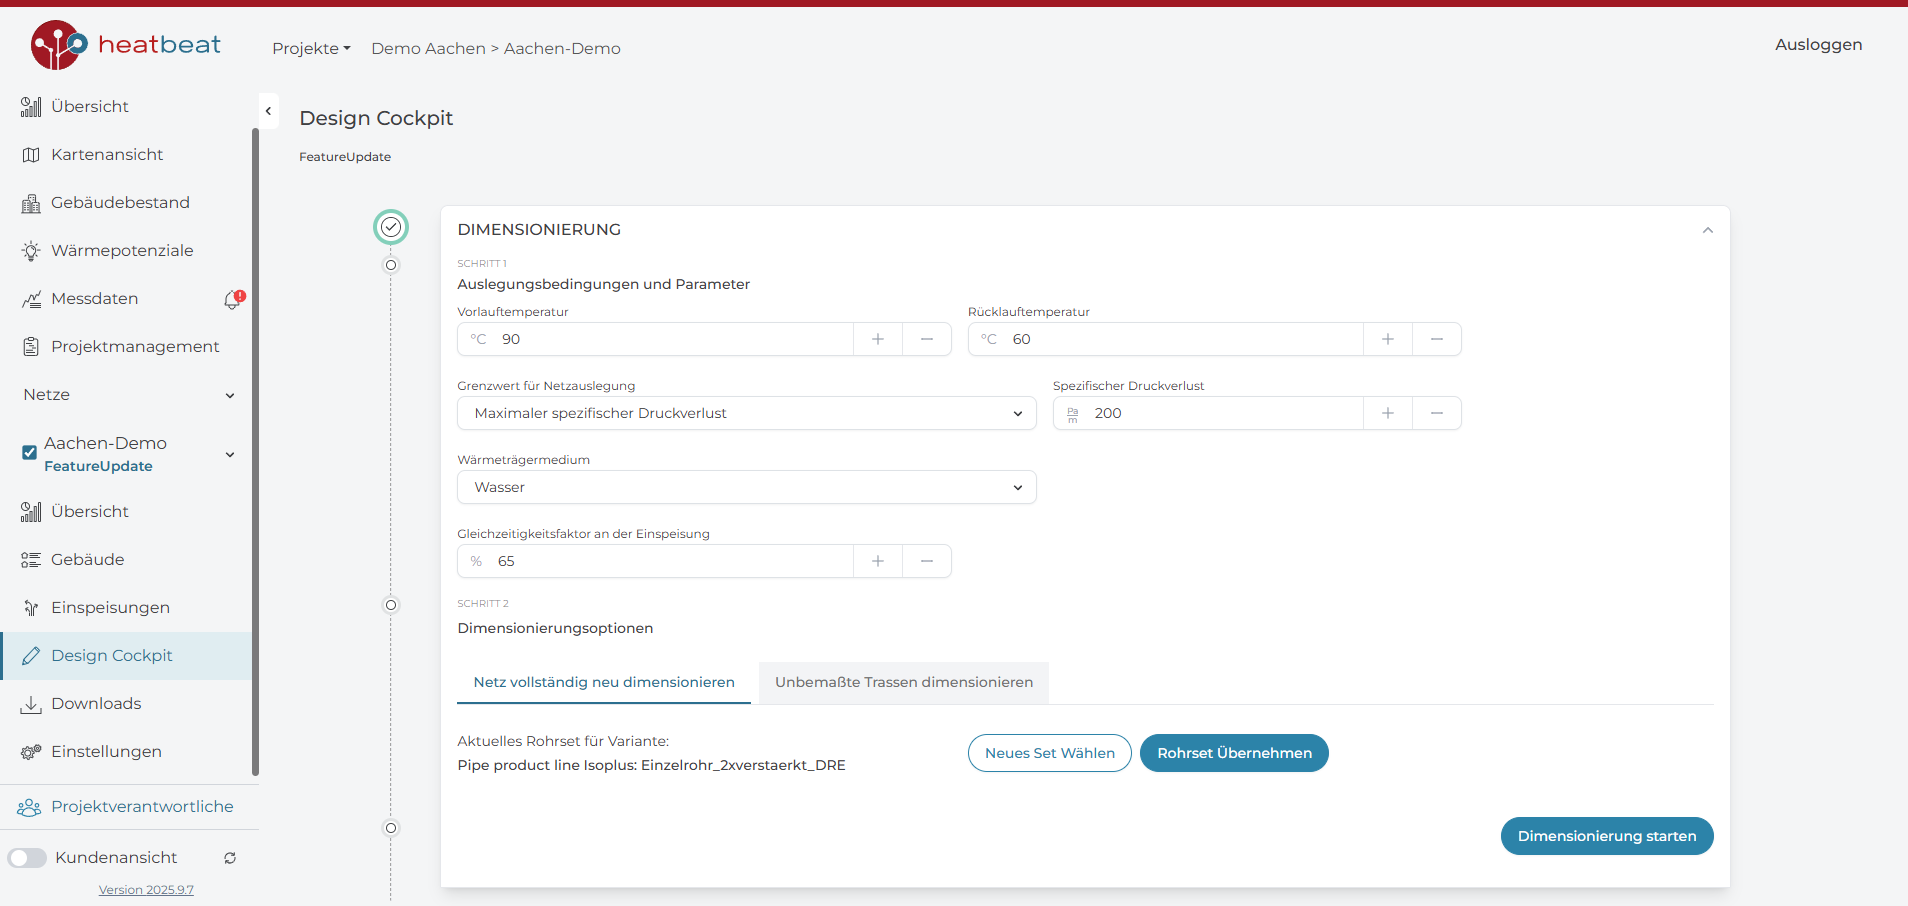
Together with the new editing mode, our Design Cockpit now enables optimal sizing of nominal diameters in the heating network. In addition to design temperatures, the threshold for network sizing can also be freely selected – both a target value for maximum specific pressure loss and for flow velocity are supported. Additionally, heat transfer medium (e.g., water to water-glycol mixtures in cold local heating networks), simultaneity factor, and pipe types can be flexibly configured. It is also possible to conveniently switch between sizing the entire network for feasibility studies and restricting to unmeasured route sections in the variant for existing networks.
Extended measurement data analysis and views
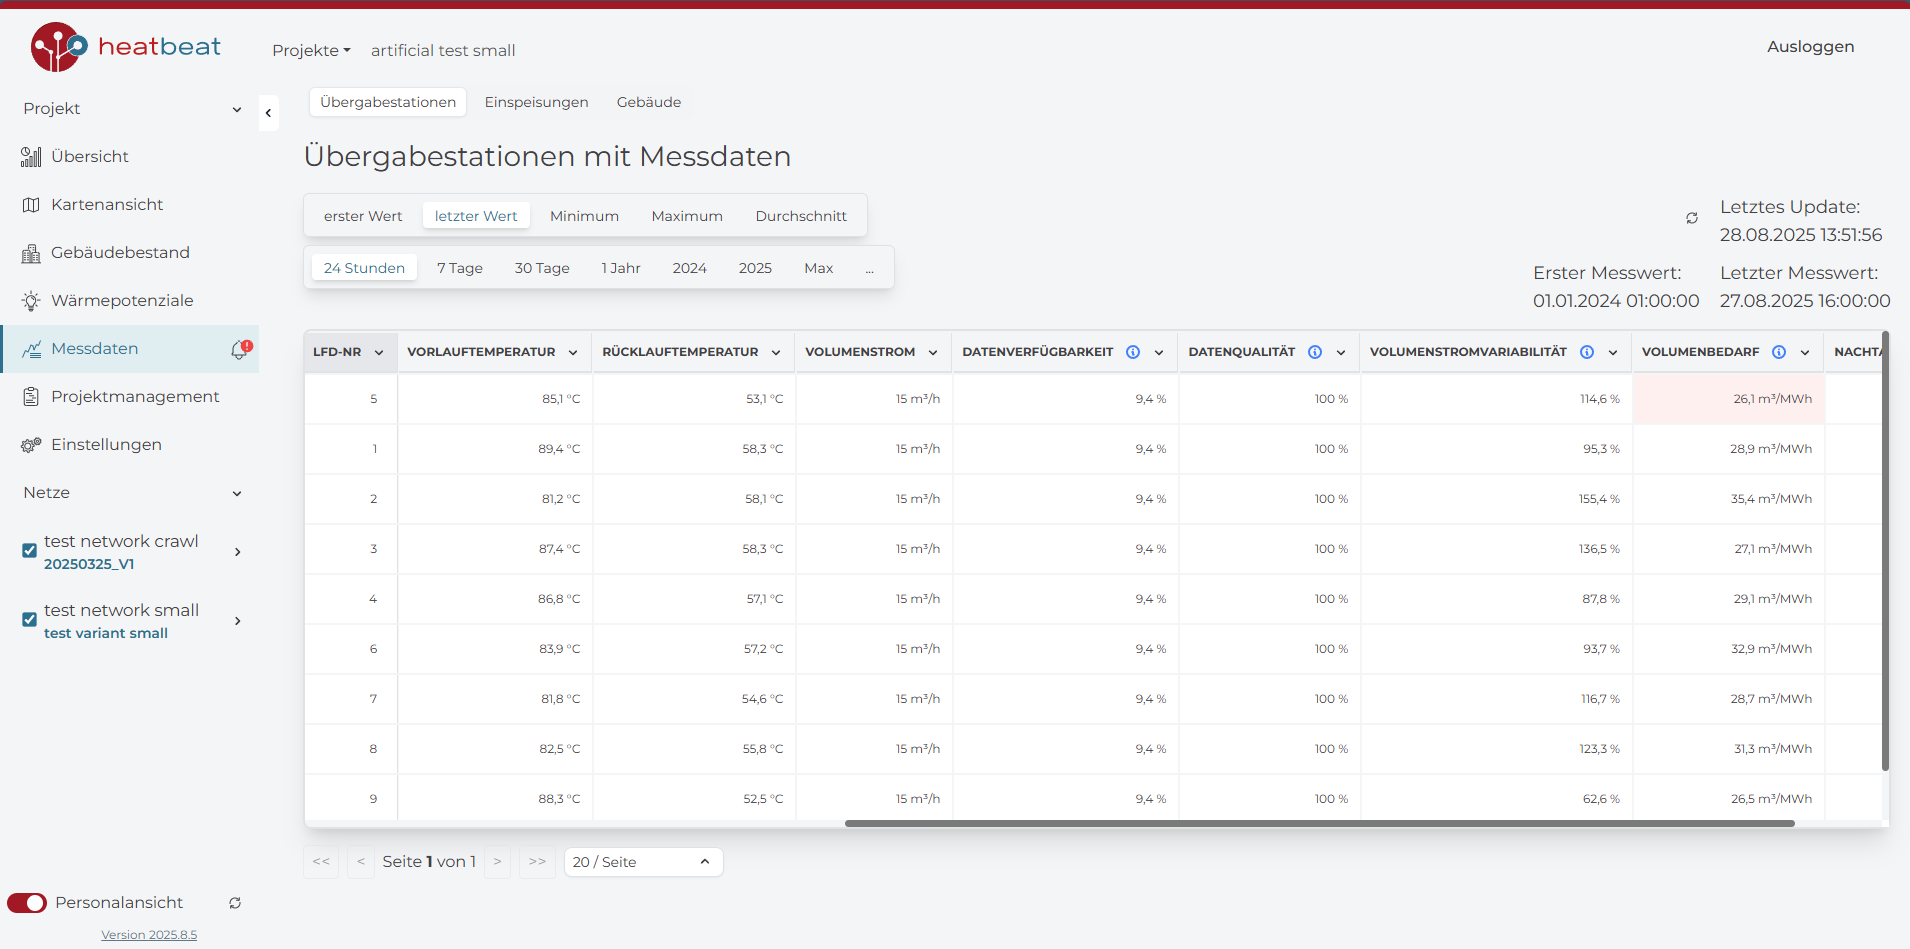
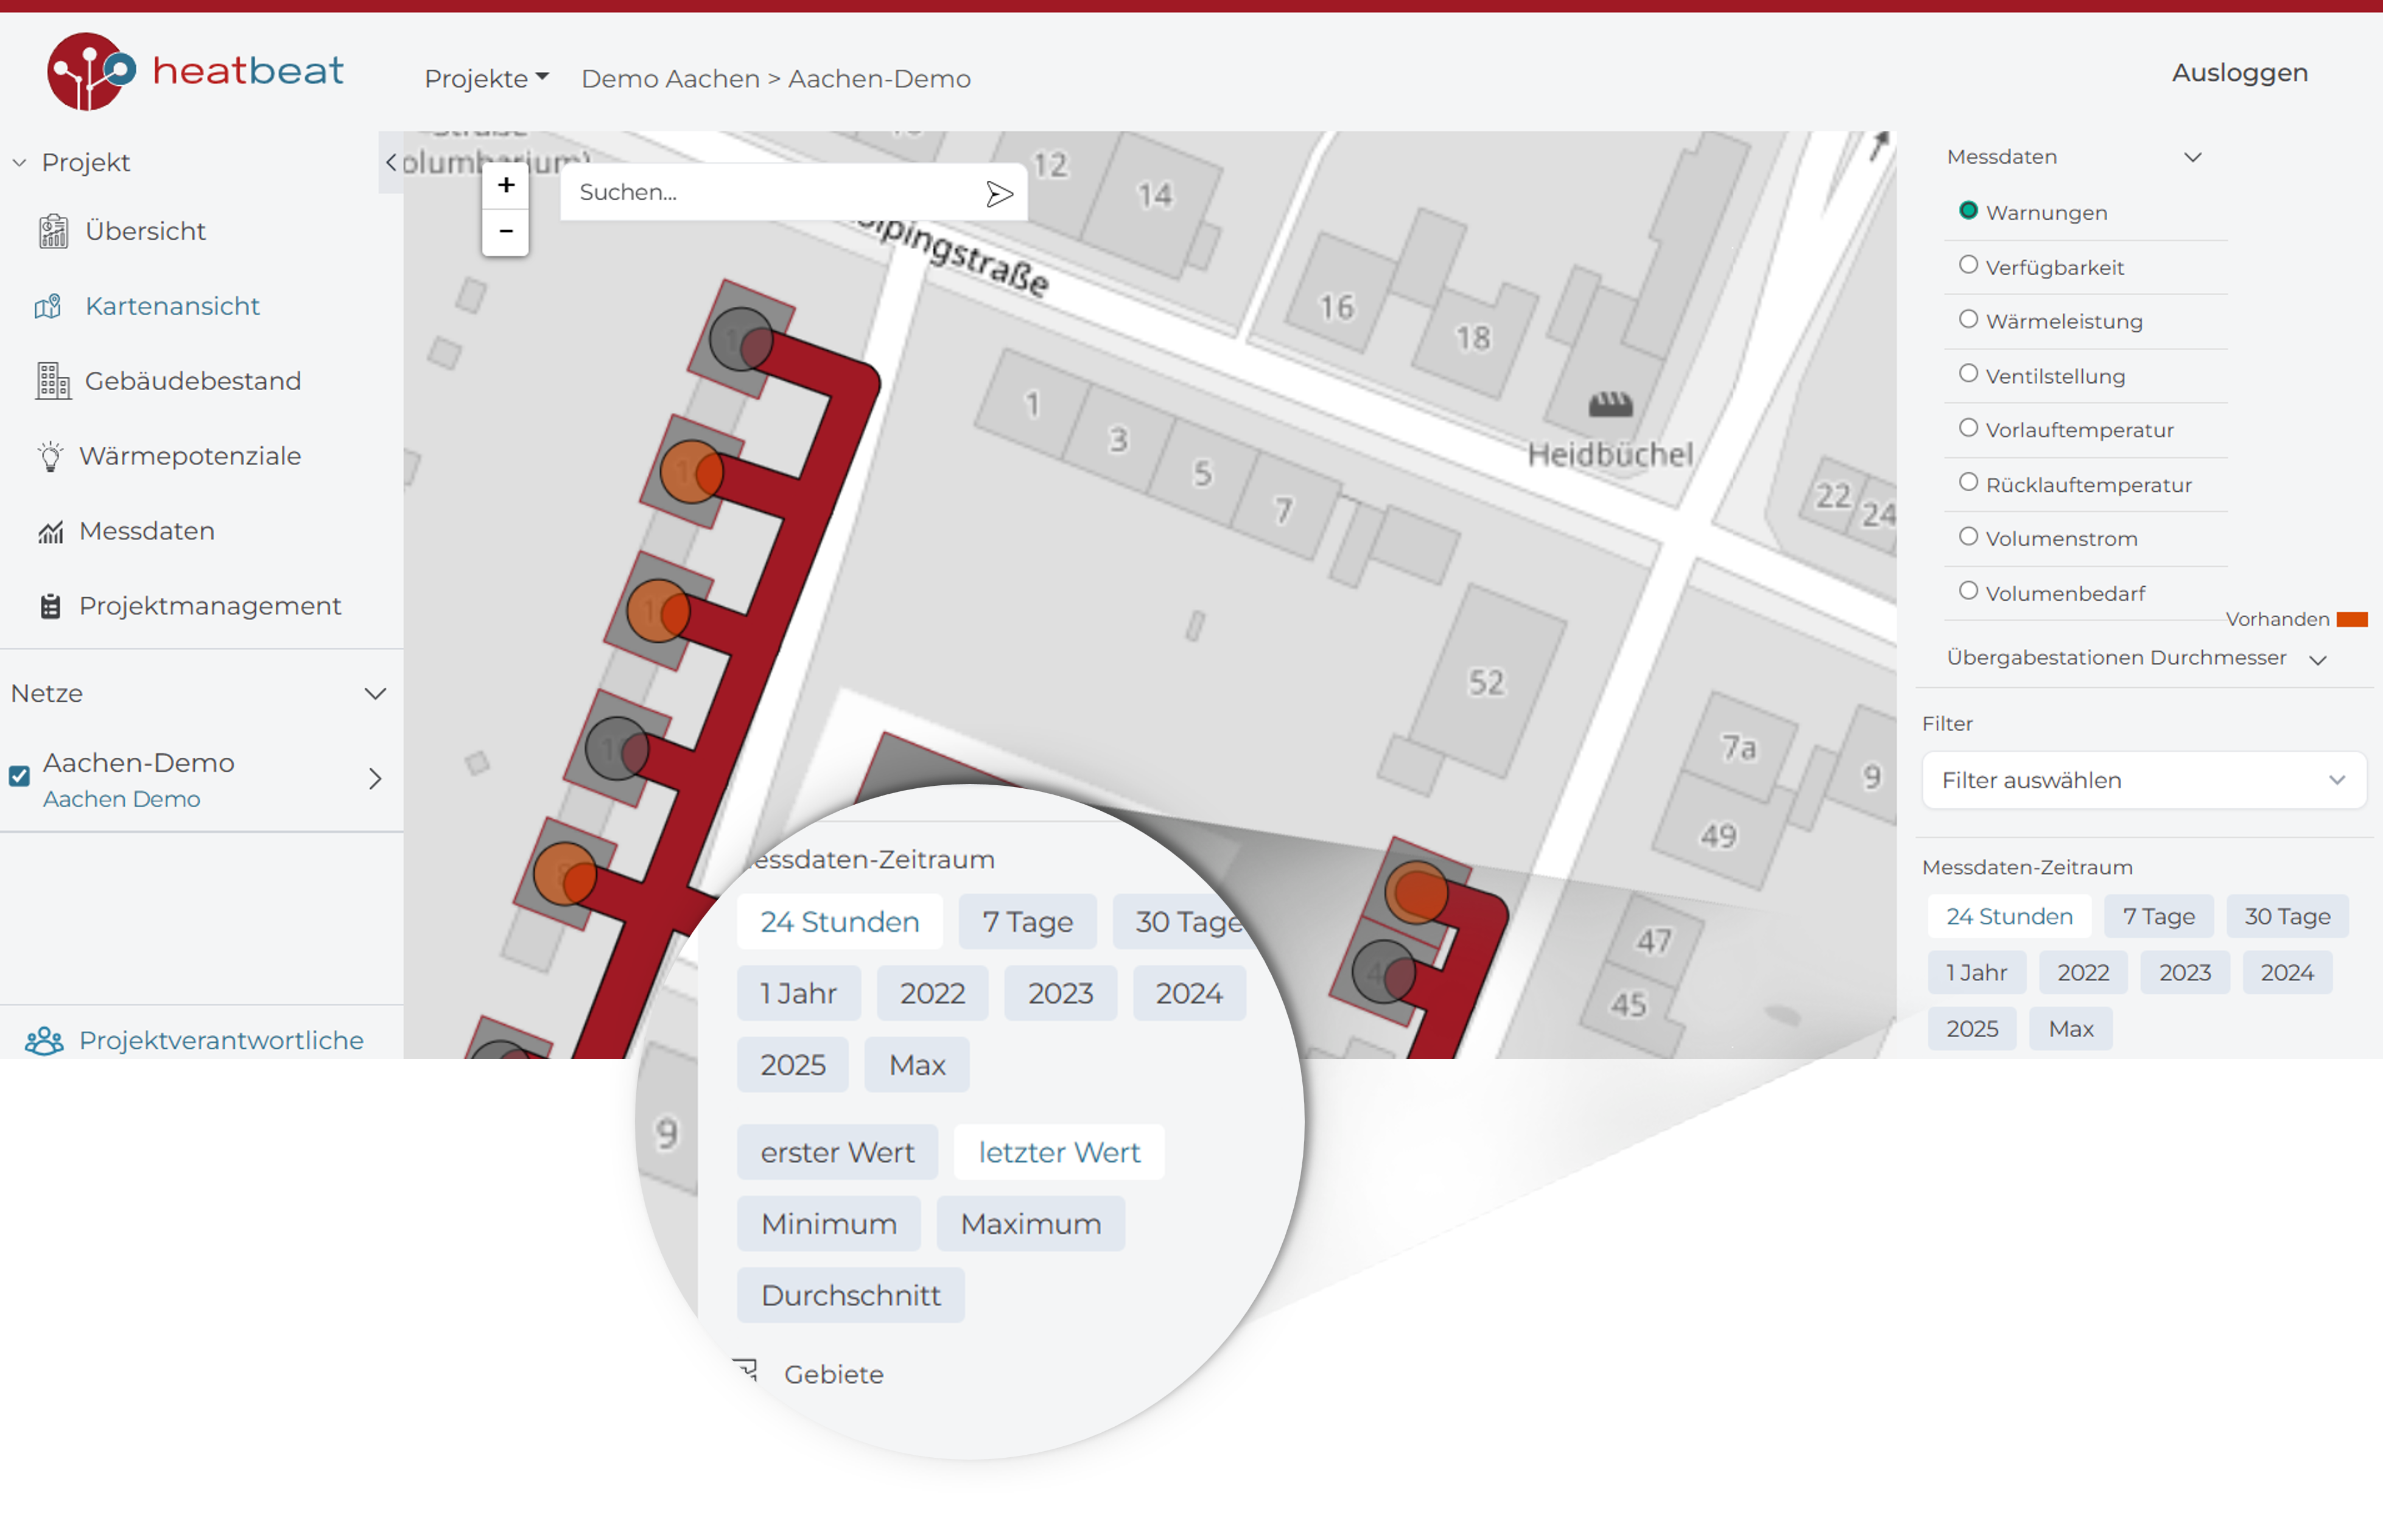
For our Insights module for analyzing measurement data, the analysis functions and visualizations have been significantly expanded. All data and evaluated KPIs are now available both in the extended measurement data table and interactively in the map view. This makes it easier to identify spatial and temporal patterns, detect errors, and uncover optimization potential. A quick look at the organized data and the map, for example, shows buildings whose house stations return excessively high return temperatures to the network, regularly exceed or fall short of their contractual connection capacity, or have excessively high volume demands.
Additional highlights
In addition to the new features mentioned above, we were also able to improve the interactive management of variants for network calculation and future scenarios. In the building dashboards, all building data can now be easily and directly adjusted. The download functions for exporting data from the Digital Twin have also been significantly expanded. Furthermore, we implemented numerous performance improvements and user interface adjustments for even more efficient work in the heatbeat Digital Twin.
Outlook and upcoming dates
We are pleased that we were able to welcome many interested participants to our first Feature Update Live, present the new features in detail, and answer your questions directly. And we have set ourselves some goals for the coming months to further improve our Digital Twin – directly aligned with your wishes, which reach us from daily operations as well as from the questions here in the webinar. Therefore, we look forward to welcoming you again at the next editions of this webinar series. The next dates are already set and registration is already possible:


