Digital Twin Feature Update: Oktober
Dear readers,
With the latest feature update for version 2025.10 of our heatbeat Digital Twin, we would like to present some highlights from our ongoing development – in addition to our new quarterly Feature Update Live webinar.
The following features are particularly worth highlighting from the latest weekly updates to our Digital Twin: exciting new functions in edit mode, the option to create projects, dashboard integration of weather data, and a self-service option for simulation data.
New functions in edit mode
With the new edit mode, you can interactively customise your digital twin of the heating network directly in the map view. Whether you want to add or remove network connections or adjust the route of pipes, all of this can now be done intuitively and visually.
Exciting new features have been added over the last month. In addition to consumers, feed-ins can now also be added in edit mode. With just a few clicks, you can draw new feed-ins or convert existing buildings into feed-ins.
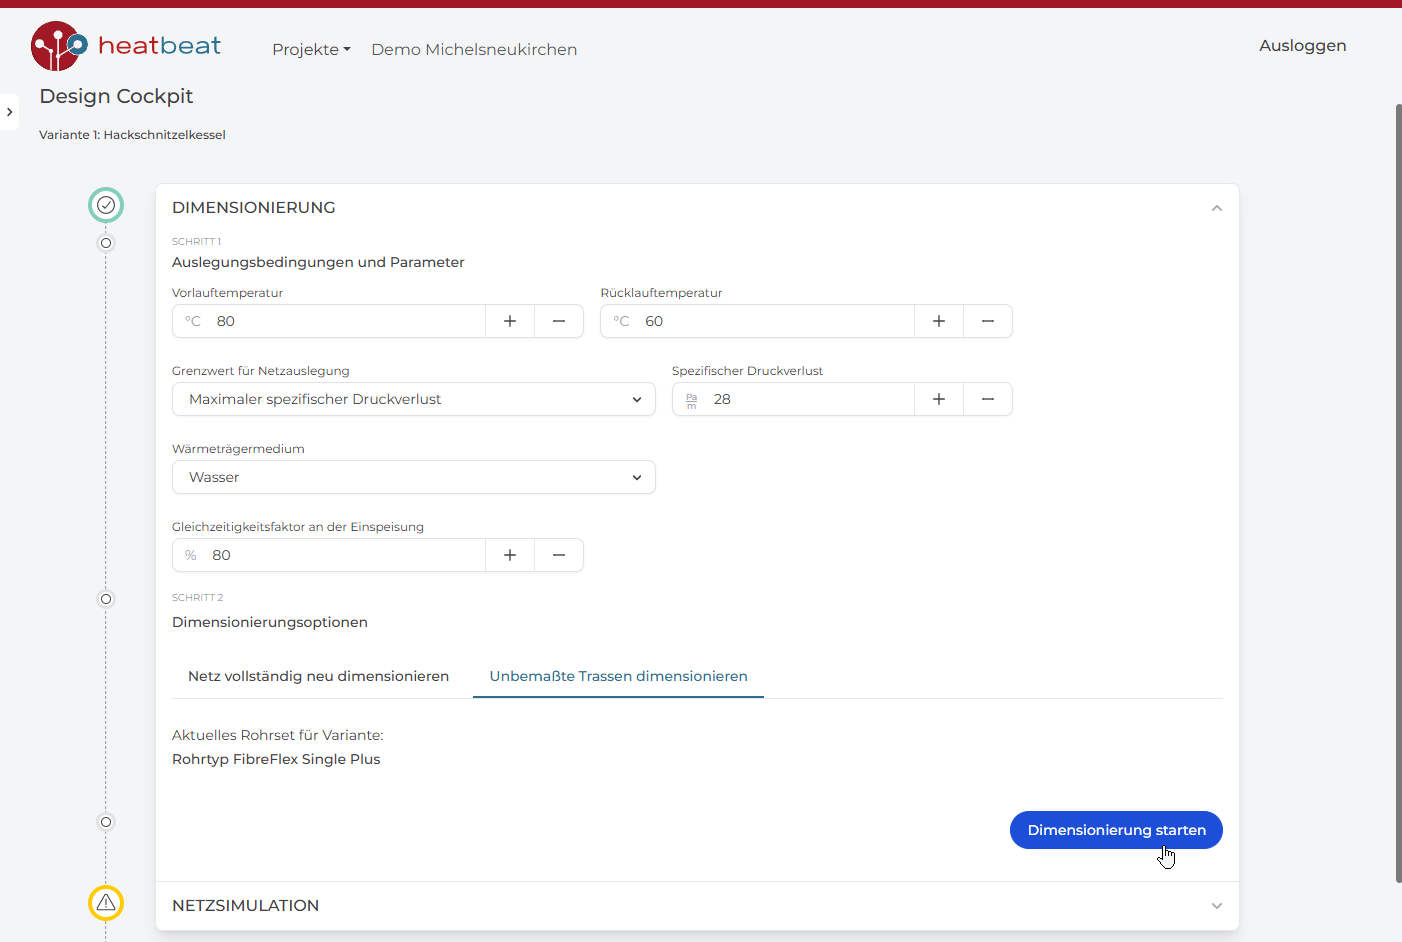
We have also fundamentally revised the option for dimensioning the nominal diameters of your network. You can now set nominal diameters manually to map your existing network.
Our new design cockpit provides you with automated nominal width dimensioning. You can now decide for yourself for which route sections you would like to receive a dimensioning proposal calculated by us and at which points your existing network should be taken into account. To do this, simply apply the calculation to undimensioned routes.
Create projects independently
heatbeat supports you from the initial idea to the economic operation of your network. The latest developments in our Digital Twin also meet this requirement: you now have the option of creating new projects independently in the Digital Twin.
With just a few clicks, you can access waste heat potential and local weather data. This allows you to get off to the best possible start with your network planning.
Display of historical and future weather data
For a interpretation of measurement data, the local outside temperatures for each generator and each feed-in are now displayed directly in the dashboard. This includes both historical temperature data and a 7-day weather forecast, which is clearly arranged and context-related.
This is the start of a series of planned features that will integrate weather data even more closely into the digital representation of reality.
Self-service for generator simulation data
We now offer you the option of managing generator simulation data yourself. You can conveniently download time series via the dashboards, process them locally and then upload them again.
This opens up new possibilities: you can customise your simulation data and visualise it directly in the digital twin. This creates more flexibility and control when modelling and analysing your energy systems and integrating them into your internal processes.
And that's just the beginning – we are already working on enabling you to store measurement data for feed-ins and generators in the future.
Feature Update Live
On 1 October, we launched the first Feature Update Live – our new quarterly format that provides concise and practical information about the latest developments in the heatbeat Digital Twin. The webinar series summarises the highlights in a practical and interactive way!
The next dates have already been set and registration is now open via the following links:


